

Overview
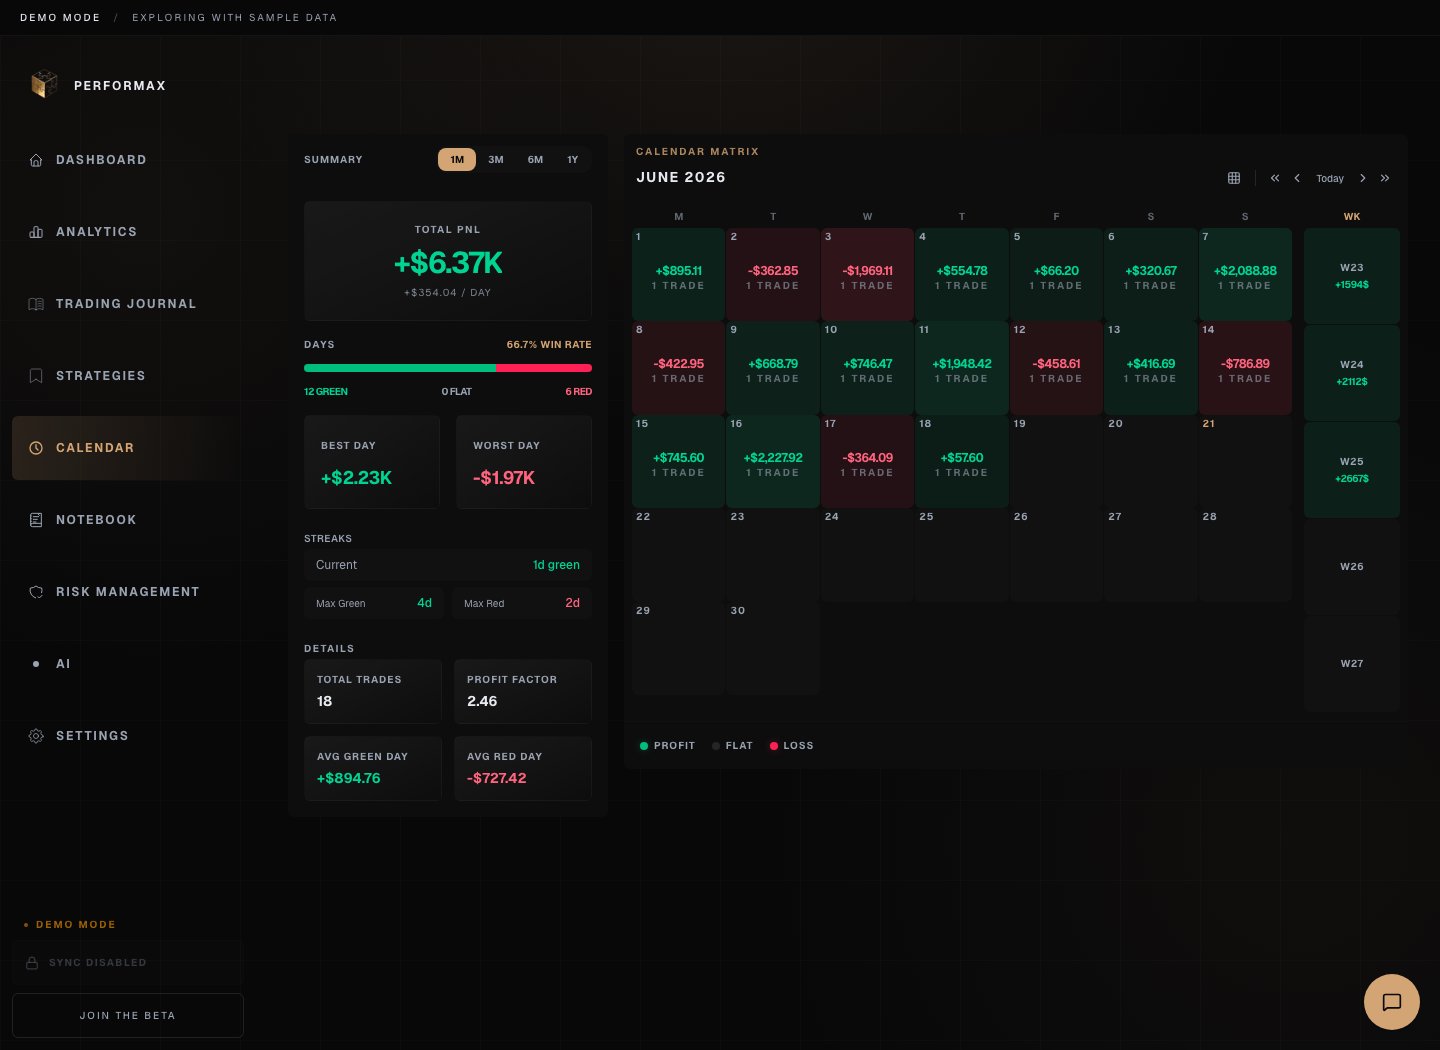
The calendar shows each trading day with color-coded P&L indicators. Use it to separate profitable, losing, and inactive days.Calendar View
Monthly View
See an entire month at a glance:- Green days - Profitable days
- Red days - Losing days
- Gray days - No trading activity
- Intensity - Darker colors indicate larger P&L
Day Cells
Each day shows:- Daily P&L
- Number of trades
- Win rate for the day
Daily Recap
Click on any day to see a detailed recap: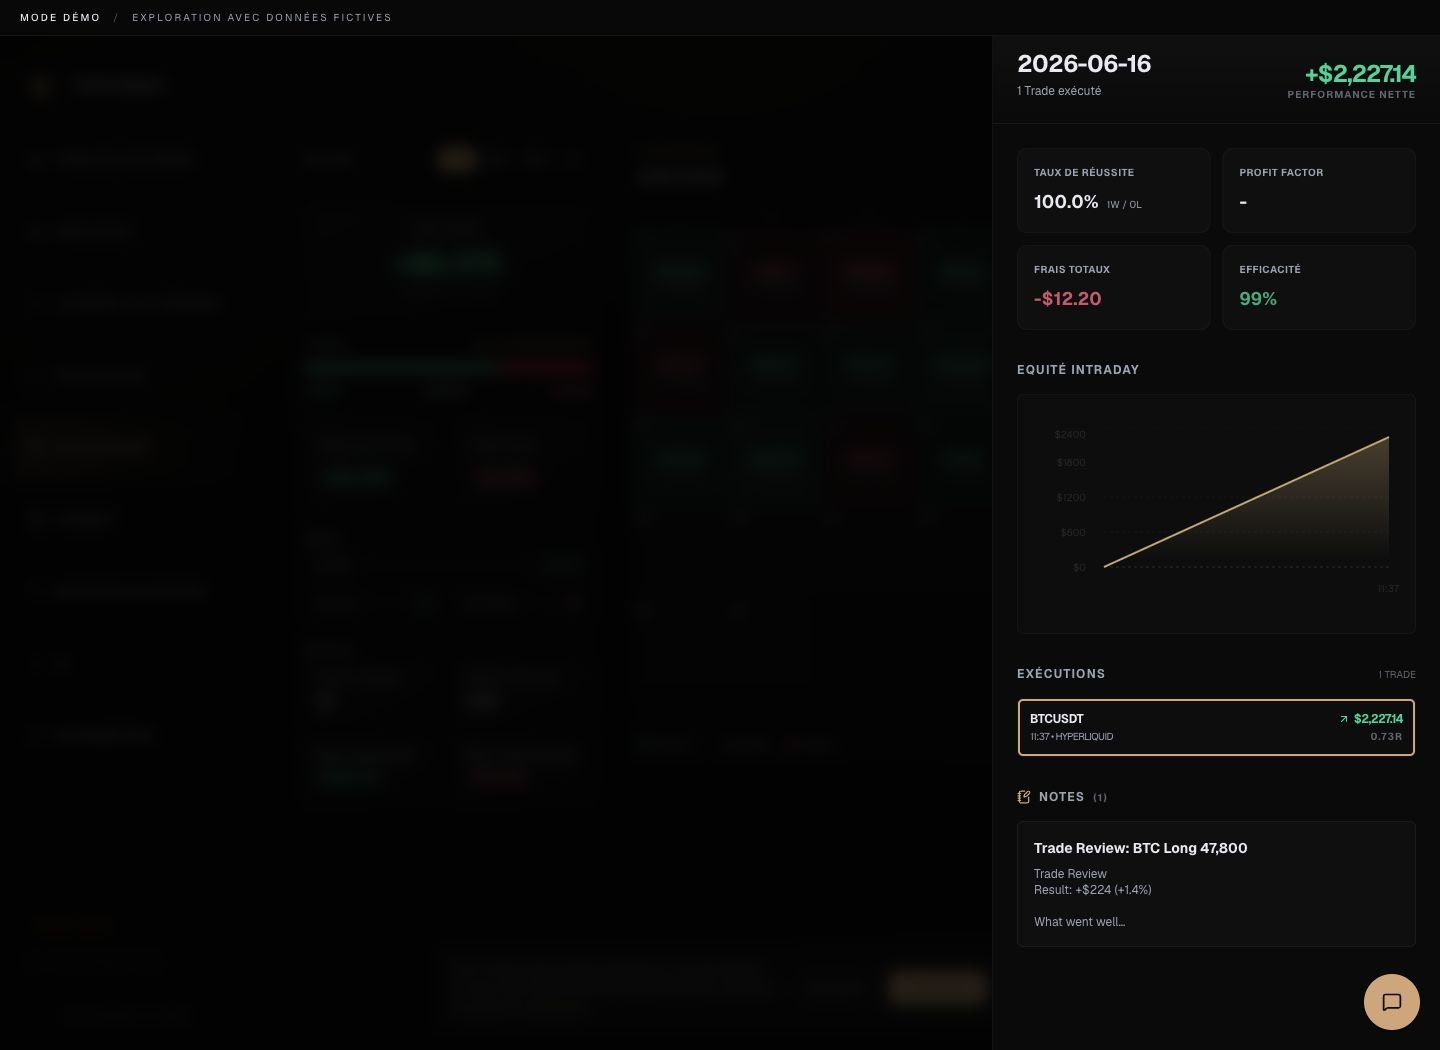
Summary
- Total P&L
- Number of trades
- Win rate
- Best trade
- Worst trade
Trade List
All trades executed on that day with:- Symbol
- Direction
- P&L
- Entry/Exit times
Session Analysis
If you traded multiple sessions:- Asian session P&L
- European session P&L
- US session P&L
Notes
Add daily notes:- Market conditions
- Your mental state
- Key observations
- Lessons learned
Patterns
Time-Based Patterns
- Best day of the week
- Best time of day
- Seasonal trends
Behavioral Patterns
- Overtrading days
- Revenge trading after losses
- Performance after winning streaks
Quick Navigation
- Arrow keys - Navigate between months
- Today button - Jump to current day
- Click & drag - Select date range when the current UI exposes range selection