

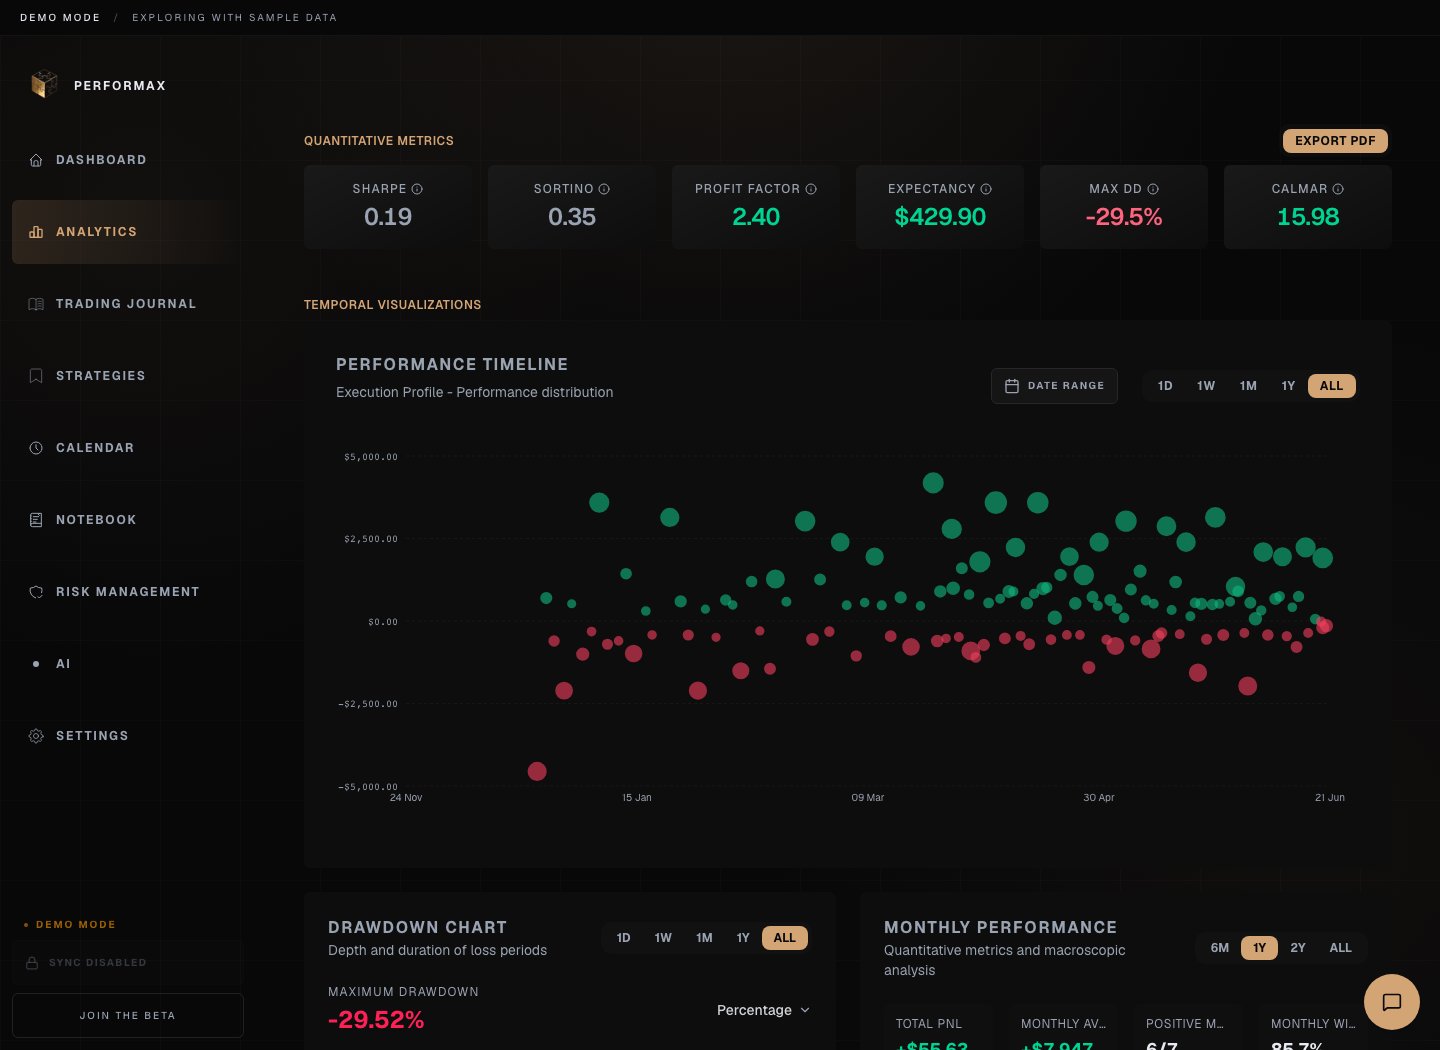
Scope controls
Before reading a metric, check:- selected account or all accounts;
- selected period;
- strategy/playbook filter;
- symbol filter;
- base currency;
- whether the dataset contains closed trades.
Quant metrics
Charts
Performance timeline
Shows performance over time for the selected scope. Closed trades should use realized dates. If a trade has no exit date, the app can fall back to entry date.Underwater chart
Shows drawdown periods. If deposits or withdrawals exist, use cashflow-aware interpretation. Missing cashflows can make drawdown look worse or better than reality.Monthly histogram
Groups realized P&L by month. Check timezone and realized-date behavior before comparing it with exchange statements.Risk analysis
R-Multiple distribution
Shows trade results in units of risk. Use it only after risk per trade and stop/risk data are configured well enough.MAE/MFE analysis
MAE and MFE describe how far trades moved against or in favor of the position before exit. Use this view to review execution quality, not to infer future market behavior.Behavioral analysis
Analytics can break down performance by:- streaks;
- trade duration;
- day and hour;
- symbol;
- correlation;
- strategy/playbook.
PDF export
PDF export uses the selected scope and available metrics. Before sharing a report: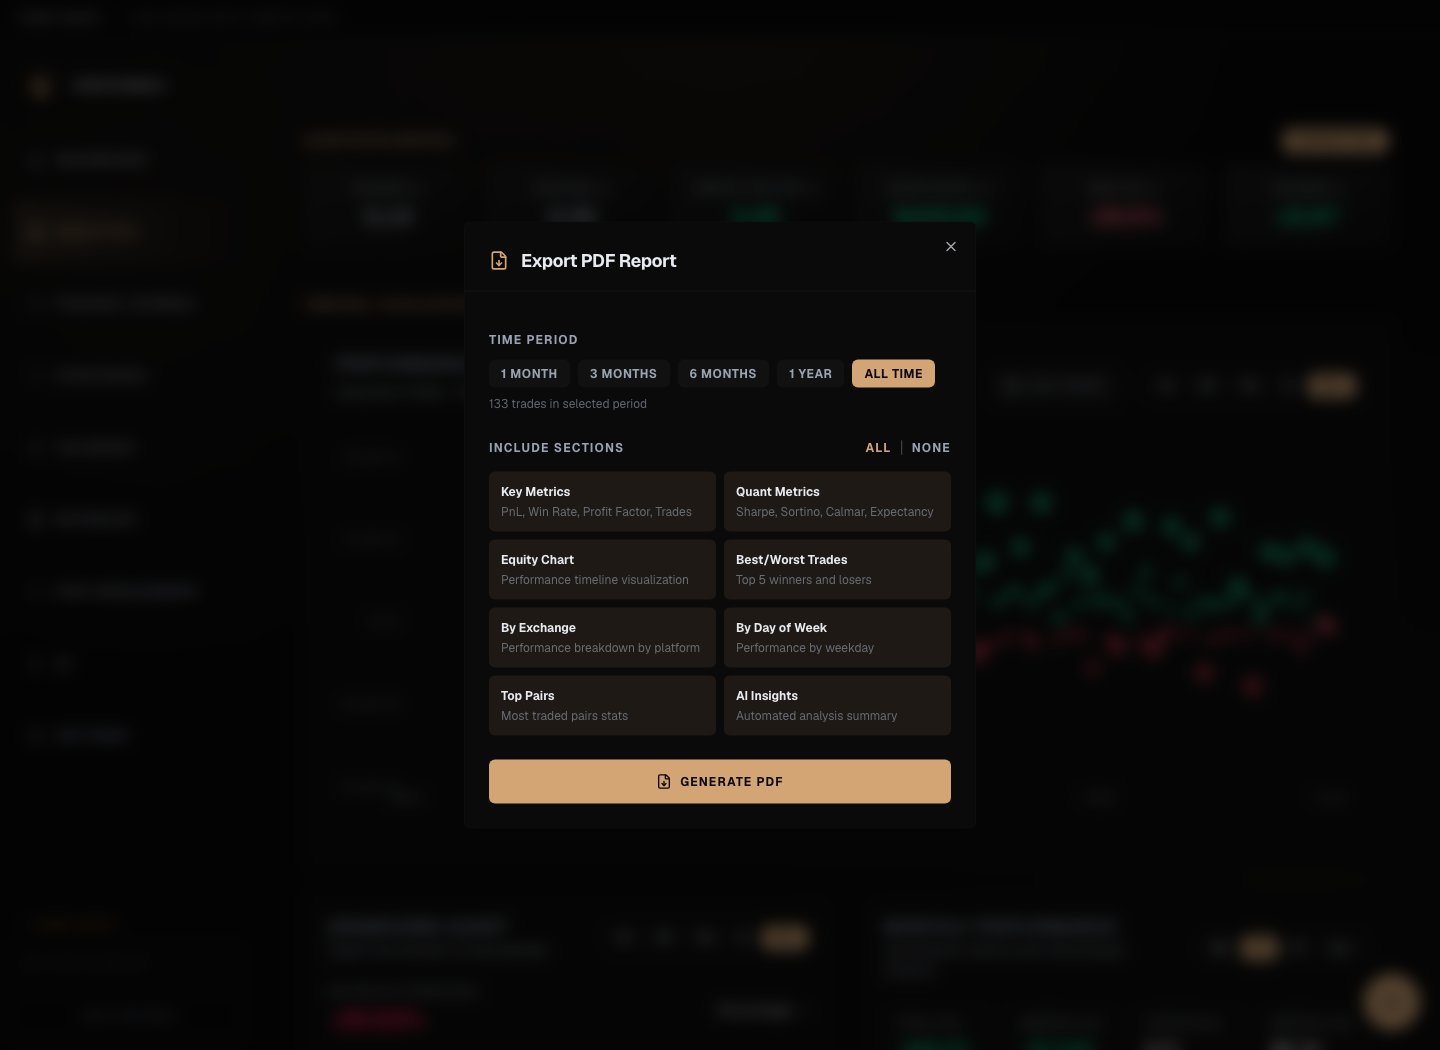
- Confirm account and period filters.
- Confirm the chart data is not partial.
- Check that privacy-sensitive values are safe to share.
- Add context outside the export if cashflows or exchange history are incomplete.
Empty or warning states
Analytics may show empty or partial data when:- there are no closed trades;
- first sync is still running;
- an exchange history window is limited;
- cashflows are missing;
- credentials failed during sync;
- filters exclude all trades.